Johnson & Johnson, a leading healthcare company, has seen its stock price fluctuate in recent times. As of now, the company’s stock is priced at $152.94 USD, marking a 0.22% increase in the past 24 hours.
The market has been closely watching Johnson & Johnson’s performance, with a 2.18% rise in the past week, but a 2.27% fall over the month. Despite this, the company has shown a 2.28% increase over the last year.
As we delve into the analysis, we’ll examine Johnson & Johnson’s business model, operating in Innovative Medicine and MedTech segments, and provide insights into its earnings and future outlook.
Current Market Position of Johnson & Johnson
As a leading player in the pharmaceutical and medical devices sector, Johnson & Johnson’s market position is noteworthy. The company’s market capitalization stands at $367.98 billion, indicating its significant presence within the healthcare industry.
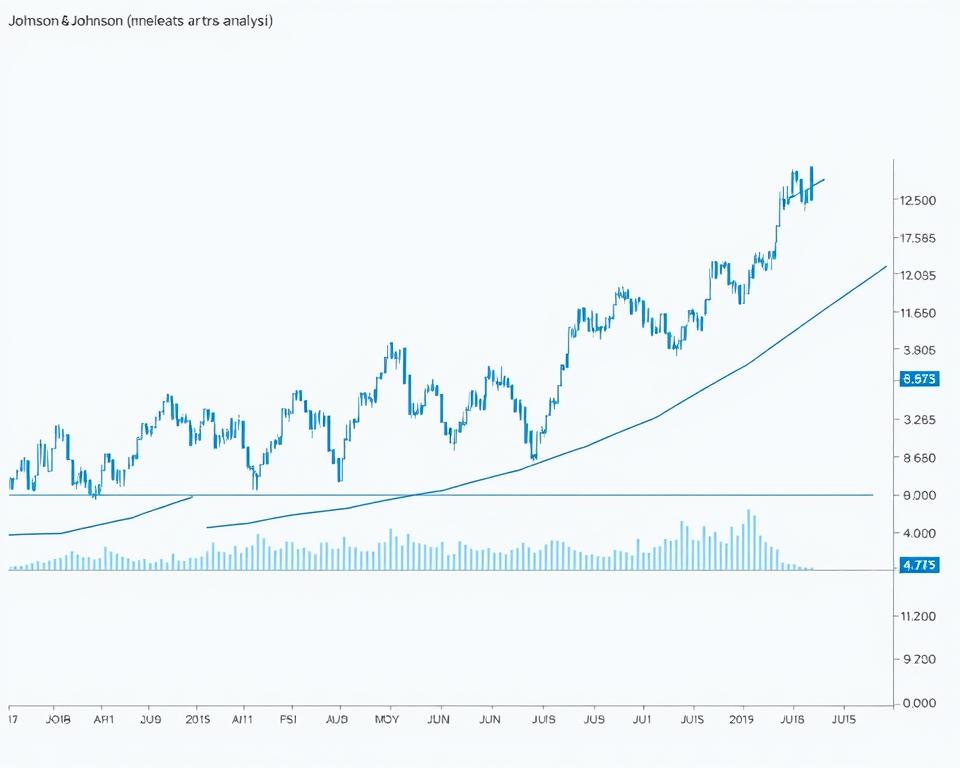
Recent Price Movements and Trading Volume
Johnson & Johnson’s stock has shown notable price movements, with a 52-week trading range of $140.68 to $169.99. Analyzing the current price in relation to these boundaries provides insight into investor sentiment. The stock’s trading volume has been substantial, reflecting its market liquidity.
52-Week Range and Performance Metrics
JNJ has outperformed the US Pharmaceuticals industry, which returned -11.5% over the past year, by achieving a positive return. However, it underperformed the broader US Market, which saw a 9.1% return. Key performance metrics, including price volatility compared to industry averages, are crucial for investors evaluating JNJ’s stock. The company’s diverse product portfolio across pharmaceuticals and medical devices has positively influenced its stock performance relative to more specialized competitors in the healthcare field.
- Johnson & Johnson’s market cap indicates its strong position in the healthcare sector.
- The company’s performance has exceeded that of its industry peers.
- JNJ’s diverse portfolio has contributed to its relative stability.
JNJ Stock Financial Analysis
Johnson & Johnson’s financial metrics offer a comprehensive view of its stock’s current standing. The company’s financial performance is a critical factor in evaluating its stock.
Market Capitalization and Valuation Metrics
Johnson & Johnson boasts a significant market presence, reflected in its market capitalization. The company’s valuation metrics provide insights into its financial health and investor confidence. With a strong brand portfolio and diversified product lines, JNJ’s market capitalization is a key indicator of its overall financial stability.
Price-to-Earnings Ratio and EPS Growth
The Price-to-Earnings (P/E) ratio of Johnson & Johnson is an essential metric for investors. With a trailing twelve-month (TTM) revenue of $89.33 billion and net income available to common shareholders of $21.81 billion, the company’s EPS growth is a crucial factor in determining its stock’s attractiveness. JNJ’s P/E ratio, compared to industry averages, helps investors understand the stock’s valuation relative to its earnings.

Revenue and Net Income Trends
Johnson & Johnson’s revenue and net income trends are vital indicators of its financial performance. The company’s TTM revenue stands at $89.33 billion, with a net income of $21.81 billion. The profit margin of 24.42% and return on equity of 29.45% demonstrate JNJ’s operational efficiency and ability to generate profits from its resources. Analyzing these trends helps investors understand the company’s growth trajectory and potential future performance.
Business Segment Performance
Johnson & Johnson’s business is diversified across multiple segments, with significant contributions from both its Innovative Medicine and MedTech divisions. This diversification allows the company to maintain a strong presence in the healthcare field.
Innovative Medicine Segment Overview
The Innovative Medicine segment is a crucial part of Johnson & Johnson’s research and development efforts, focusing on creating innovative drugs that address significant medical needs. This segment has seen considerable growth due to the successful launch of new products and the continued demand for existing pharmaceuticals.
MedTech Segment Developments
The MedTech segment provides a wide range of medical products, including electrophysiology products, orthopaedics, surgical technologies, and vision care solutions like ACUVUE contact lenses and TECNIS intraocular lenses. Recent developments in this segment have been driven by advancements in technology and the introduction of new products that cater to evolving healthcare needs.
Johnson & Johnson’s MedTech segment has been impacted by trends such as the shift to outpatient procedures and value-based care initiatives. The company’s ability to innovate and adapt to these changes will be crucial for its future growth prospects in the competitive medical device market.
Dividend Analysis and Shareholder Returns
With over 60 consecutive years of dividend increases, Johnson & Johnson stands out as a leader in shareholder returns. This impressive track record solidifies its position as a Dividend Aristocrat, a distinction reserved for companies with a long history of consistent dividend growth.
Current Dividend Yield and Payout Ratio
Johnson & Johnson’s current dividend yield is an attractive feature for income-focused investors. The company’s payout ratio, which is the proportion of earnings paid out as dividends, is a key metric for assessing the sustainability of its dividend program. As of the latest reports, the payout ratio remains reasonable, indicating a healthy balance between rewarding shareholders and retaining earnings for future growth.
Dividend History and Growth Patterns
The company’s dividend history reveals a consistent pattern of growth, with increases spanning multiple decades. Key highlights include:
- Over 60 consecutive years of dividend increases
- Steady dividend growth through various economic cycles
- A commitment to increasing dividends that outpaces earnings growth in some periods

This long-term commitment to dividend growth has significantly contributed to total shareholder returns, making Johnson & Johnson an attractive option for long-term investors seeking both income and capital appreciation.
Analyst Perspectives on JNJ Stock
Johnson & Johnson’s financial health and stock performance are closely watched by analysts, who provide price targets and recommendations based on its earnings and revenue growth.
Price Targets and Recommendations
Analysts have issued various recommendations for JNJ stock, with price targets reflecting their expectations for the company’s future performance. The consensus among analysts suggests a positive outlook for JNJ, driven by its robust EPS growth and diversified portfolio of pharmaceutical drug products.
Consensus Estimates for Future Earnings
The estimated earnings for JNJ’s next quarter are $2.68 per share, indicating a stable financial performance. The company’s revenue for the last quarter was $21.89 billion, exceeding the estimated $21.56 billion. Looking ahead, revenue is expected to reach $22.84 billion in the next quarter, driven by the company’s strong product pipeline and strategic initiatives from its headquarters in New Brunswick. Analysts are optimistic about JNJ’s future, citing its trailing twelve months (TTM) performance as a positive indicator.
Risk Factors and Investment Considerations
To make informed investment decisions about Johnson & Johnson, it’s essential to analyze the company’s risk profile and financial health indicators. The healthcare industry is highly competitive, and JNJ must navigate various market challenges to maintain its position.
Industry Competition and Market Challenges
Johnson & Johnson operates in a highly competitive environment, with numerous players in the pharmaceutical, medical devices, and consumer goods markets. The company’s ability to innovate and bring new products to market is crucial for its success. Challenges include managing the product lifecycle, addressing regulatory changes, and responding to competitor activity. The manufacture and sale of medical devices and pharmaceuticals are subject to stringent regulations, and any failure to comply can result in significant financial penalties.
Debt Levels and Financial Health Indicators
Johnson & Johnson’s financial health is a critical factor in its investment appeal. The company’s debt-to-equity ratio stands at 66.90%, indicating a moderate level of leverage. However, with a total cash position of $38.78 billion and levered free cash flow (TTM) of $16.8 billion, JNJ has significant financial resources to service its debt and invest in growth opportunities. Key financial health indicators, including interest coverage ratios and liquidity metrics, suggest a strong financial position, with a financial health rating of 5/6. The company’s ability to manage its debt and maintain a healthy balance sheet is essential for its long-term success.
By examining these risk factors and financial health indicators, investors can gain a more comprehensive understanding of Johnson & Johnson’s investment potential and make more informed decisions.
With a strong presence in both the Innovative Medicine and MedTech segments, Johnson & Johnson is well-equipped to navigate the evolving healthcare landscape.
The company’s commitment to engaging in research has yielded a robust pipeline of new drugs and therapies, positioning it for long-term growth. Johnson & Johnson’s history of successful innovation and its ability to adapt to changing market conditions make its stock an attractive option for investors seeking stability and potential for growth.
Additionally, Johnson & Johnson’s track record of consistently paying dividends makes it a reliable income investment. As the company continues to innovate and expand its presence in key markets, investors can expect sustained performance from its innovative medicine segment.